Consumers feeling pinch of recent spike in energy, food and other goods and services
April 19-25, 2021
By Wesley Brown
As the robust economic recovery continues under President Joe Biden’s broad economic stimulus plan, many consumers and key business sector are concerned that rising consumer and wholesale prices could take the steam out of the current upturn.
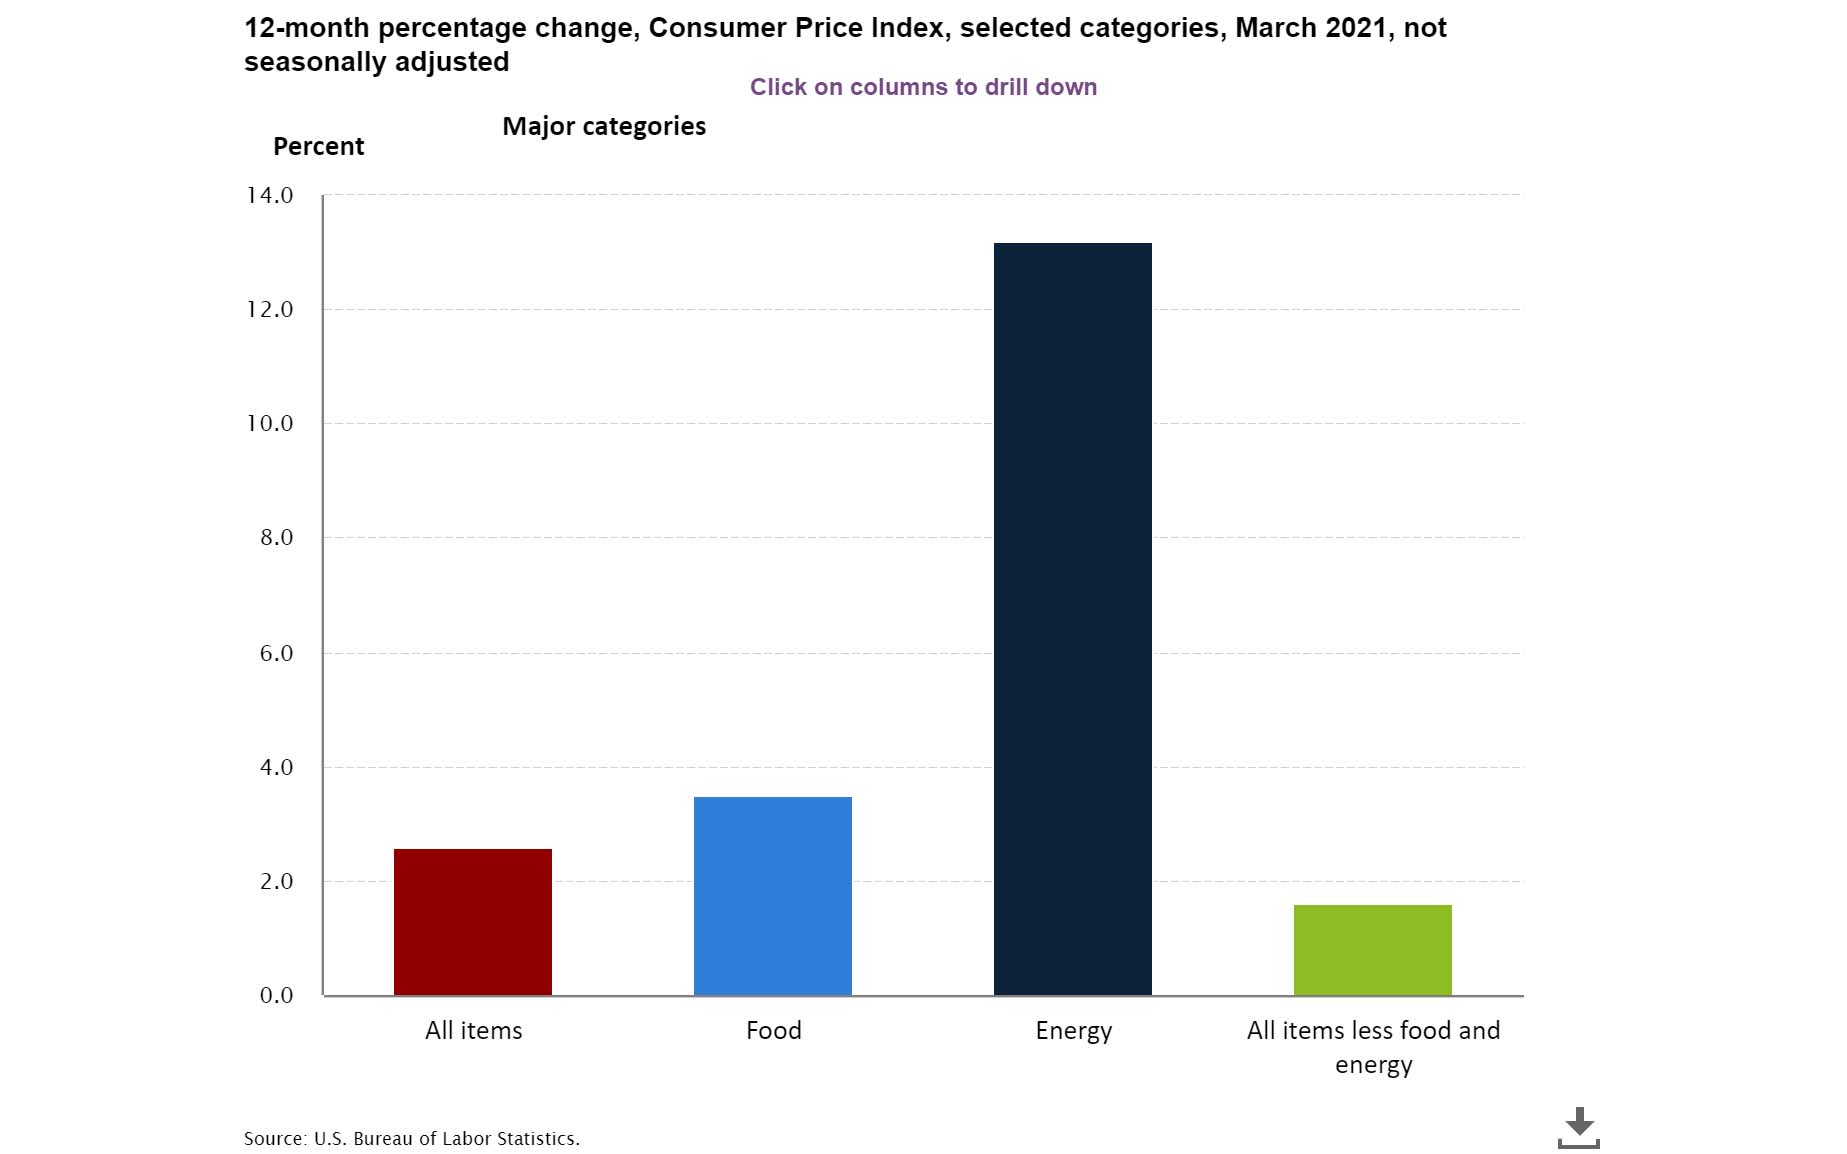
In March, the Consumer Price Index for All Urban Consumers spiked 0.6% on a seasonally adjusted basis, the largest one-month gain since August 2012. That one-month jump comes after the nation’s CPI index rose 0.4% and 0.3% percent in February and January, respectively. Over the last 12 months, the so-called “all items” index jumped 2.6%, well over the Federal Reserve’s 2% yearly inflation target.
More specifically, the highly watched index produced each month by the U.S. Labor Department’s Bureau of Labor Statistics (BLS) shows that energy prices have skyrocketed in the first quarter of 2021. For example, the CPI’s energy index continued to rise in March, increasing 5%. The index for gasoline was again the dominant factor in the increase, rising 9.1% over the month and accounting for over half of the seasonally adjusted increase in the all items index. In February, the gas index also rose a robust 6.4%.
On the other hand, the natural gas index increased 2.5% over the month, and the electricity index was unchanged in March. For the year, the energy index has jumped 13.2%. The gasoline index rose 22.5% over the last 12 months, while the index for natural gas increased 9.8%.
The index for all items less food and energy rose 0.3% in March. The shelter index increased in March as did the motor vehicle insurance index, the recreation index, and the household furnishings and operations index. Indexes which decreased over the month include apparel and education.
The CPI’s benchmark all items index rose 2.6% for the year, a much larger increase than the 1.7% reported for the period ending in February with 9 months still left in the calendar year. The index for all items less food and energy rose 1.6% over the last 12 months, after increasing 1.3% over the 12-month period ending in February.
The food index also increased 0.1% in March. The index for food at home also rose 0.1 percent over the month as two of the six major grocery store food group indexes increased. The index for fruits and vegetables rose 1.0 percent in March, following a 0.7% spike in February. The index for meats, poultry, fish, and eggs rose 0.1 percent in March, a smaller increase than the 0.3% increase in February.
The food away from home index rose 0.1% in March, continuing a long series 0f increases. The index for limited-service meals rose 0.5%, while the food at home index increased 3.3%, while the index for food away from home rose 3.7% over the last year. The index for limited-service meals rose a strong 6.5%, the largest 12-month increase in the history of the index that began in 1997.
As noted, consumers are especially seeing higher pump prices and utility bills due to rising costs associated with raw commodities used to produce energy. For example, the American Automobile Association reported Monday that refinery utilization at 84% rose to its highest measurement in 2021.
This strong utilization rate, as measured by the Energy Information Administration (EIA), helped contribute to the addition of 4 million billion barrels to U.S. gasoline stockpiles, pushing overall supply levels to 234.5 million barrels for the week ending April 2. The refinery and production increases amid a small decrease in demand and cheaper crude oil prices resulted in the national gas price average decreasing by a penny to $2.86 on the week.
“After a wild March, Americans are seeing a little stability at the pump. On the week, 40 states’ averages either increased or decreased by only a penny, or had no change at all,” said Jeanette McGee, AAA spokesperson. “Cheaper crude oil prices will likely help to keep price fluctuation low this week.”
Pump Prices: Summer forecast up 72 cents from 2020
Despite the one penny swing in April, American consumers should not be fooled into believing that trend will continue. In the EIA’s short-term energy outlook on April 9, U.S. Energy Department forecasters said they expect vaccinations and fiscal stimulus to support continuing economic recovery and drive demand growth for petroleum products such as gasoline, diesel, and jet fuel in the U.S.
“As some of the economic and behavioral effects of COVID-19 subside over the next year, we forecast that U.S. demand for transportation fuels will increase. We forecast that gasoline consumption in 2021 will peak in August at 9.1 million barrels per day (b/d), more than the 8.5 million b/d we saw in August 2020 but less than the 9.8 million b/d in August 2019,” said the EIA.
That increased fuel consumption will also cause a ramp up in pump prices. Through the summer, the EIA forecasts the retail price of regular-grade gasoline in the U.S. will average $2.78 per gallon (gal) during summer 2021, 72 cents/gal more than last summer’s average of $2.06/gal.
“Our forecast of significantly more global economic activity this summer compared with last summer contributes to higher crude oil prices, which are the largest determining factor in U.S. gasoline prices,” said the economic forecast arm of the U.S. Energy Department.
Closer to home, Arkansas remains among the top 10 least expensive markets for gasoline, according to AAA. They include Mississippi ($2.57), Texas ($2.57), South Carolina ($2.58), Louisiana ($2.61), Oklahoma ($2.62), North Carolina ($2.62), Missouri ($2.62), Alabama ($2.63), Arkansas ($2.67) and Delaware ($2.67).
Still, Arkansas’ spread from a year ago is still among the highest in the U.S. at $1.12 per gallon compared to the same period in 2020. As of Tuesday, Arkansas motorists are paying on average about $2.67 per gallon, compared to only $1.53 a year ago for a gallon of regular unleaded. Prices range from a low of $2.61 per gallon in the Little Rock-North Little Rock metro area to a high of $2.82 per gallon at the Texarkana state line.
Based on the most recent short-term forecast, which is subject to change, EIA expects monthly retail prices for diesel fuel will average $2.96 per gallon this summer, which is up from an average of $2.43 per gallon a year ago amid the COVID-19 pandemic. In Arkansas, motorists across the state are paying an average of $3.26 to fill up their tank with premium grade gasoline, while most truckers are paying about $3 per gallon for diesel fuel – 75 cents higher than a year ago.
Fed chief says inflation still below yearly 2% target
Despite the higher price increase and sticker shock that many consumers are seeing, the Fed’s Open Market Committee (FOMC) that sets U.S. monetary policy noted at its March 17 meeting that ongoing COVID-19 pandemic continues to weigh on key economy benchmarks, including inflation. However, Powell noted that since inflation has remained well below the Fed’s annual target for several years now, the recent price spikes that consumers are seeing will likely last “for some time” to achieve the Feb’s 2% target.
“The path of the economy will depend significantly on the course of the virus, including progress on vaccinations. The ongoing public health crisis continues to weigh on economic activity, employment, and inflation, and poses considerable risks to the economic outlook,” Federal Reserve Chief Jerome Powell said in statement.
“The (FOMC) seeks to achieve maximum employment and inflation at the rate of 2% over the longer run. With inflation running persistently below this longer-run goal, the Committee will aim to achieve inflation moderately above 2% for some time so that inflation averages 2% over time and longerterm inflation expectations remain well anchored at 2%,” Powell explained.
Meanwhile, the Creighton University Mid-America Business Conditions Index, a leading regional economic indicator for the nine-state regional swath stretching from Minnesota to Arkansas, remained above growth neutral. The overall Business Conditions Index, which ranges between 0 and 100, slipped to 68.9 from February’s very strong 69.6.
Also, the region’s wholesale inflation gauge for the month dipped slightly to 94 from February’s record high 95.2. According to anecdotal information obtained from regional supply managers and executives, commodity prices for the state’s steel manufacturing sector in northeast Arkansas and timberland production industry in south Arkansas are skyrocketing to near record highs.
“At the wholesale level, Creighton’s survey is tracking higher and higher inflationary pressures. Metal products and lumber, for example, are experiencing significant upward pressures in prices,” said economist Ernie Goss, director of Creighton University’s Economic Forecasting Group. “Since June of last year, metal prices have expanded by 14% and lumber products have advanced by 22% according to U.S. Bureau of Labor Statistics data. Despite rapidly expanding inflationary pressures at the wholesale level, the Federal Reserve remains committed to its current expansionary policy.”
Meanwhile, the unprecedented leap in the price of goods used in construction and supply-chain disruptions are wreaking hardships on contractors and slowing projects, according to an April 9 report by Associated General Contractors of America (AGCA). The Washington, D.C.-based construction industry trade is urging the Biden administration to end a variety of tariffs and quotas on imported construction inputs and to help ease domestic supply-chain problems.
“Today’s producer price index report documents just some of challenges contractors are experiencing with fast-rising materials costs, lengthening or uncertain delivery times, and rationing of key inputs,” said Ken Simonson, the association’s chief economist. “These problems threaten to drive up the cost and completion time for many vital projects and potentially set back the recovery in construction employment.”
Prices for materials and services used in construction and contractors’ bid prices both declined at the beginning of the pandemic but have diverged in the past year, Simonson said. A government index that measures the selling price for goods used construction jumped 3.5% from February to March and 12.9% since March 2020. Both the monthly and yearly increases were the highest recorded in the 35-year history of the series, he noted. Meanwhile, the producer price index for new nonresidential construction – a measure of what contractors say they would charge to erect five types of nonresidential buildings – increased only 0.5% last month and 1.7% over the past 12 months.
“These material cost increases – steep as they are – tell only part of the story,” Simonson added. “They are based on prices the government collected a month ago, and they fail to capture the notices contractors are receiving daily about longer lead times, shipments held to a fraction of previous orders, and other challenges.”
Association officials said some of the supply chain problems are being caused by the pandemic, which is leaving manufacturers and shippers shorthanded amid growing demand for a host of products.
Dana Peterson, chief economist at the Conference Board, the nonpartisan economic research think tank, noted in a recent opinion column that backlogs for popular pandemic-era goods – like lawn care tools, furniture, fitness equipment and laptops – are putting upward pressure on producer prices. She also said that pre-pandemic shortage of shipping containers, which hold clothes and machinery, among other goods, are also only adding fuel to the fire.
“While many businesses are trying to absorb mounting costs, at some point they reach thresholds where they must pass those costs onto consumers,” said Peterson, who was tabbed as The Conference Board’s top economist in August. “Nonetheless, a hair salon or movie theater does not necessarily need a global supply chain to operate. So, as households shift spending away from goods and back to in-person services when the pandemic subsides later this year, these supply chain woes – and the high costs associated with them – should fade.”
PHOTO CAPTIONS:
1. The Consumer Price Index shows most prices for most households goods and services spiked in March.
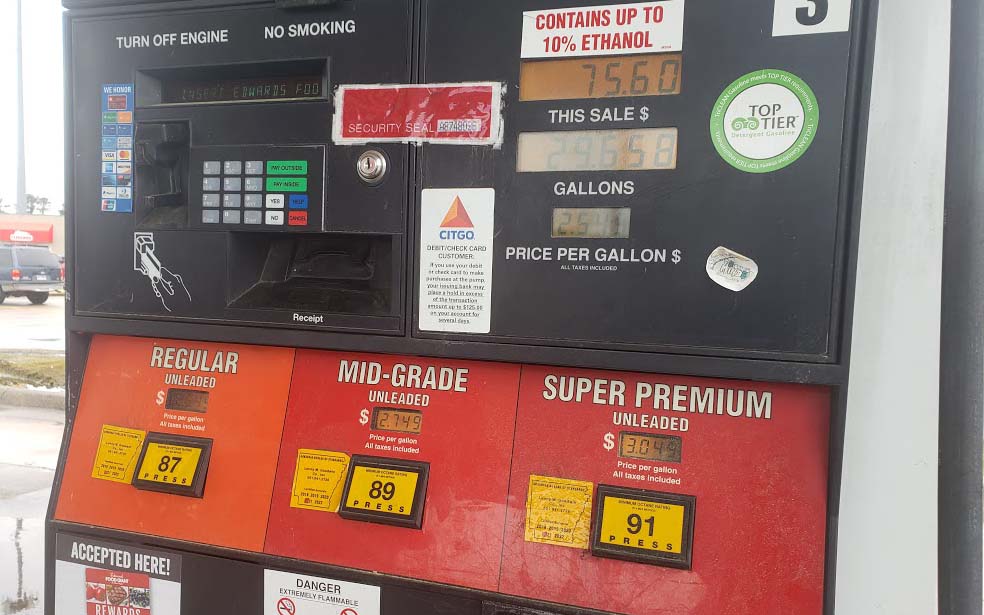
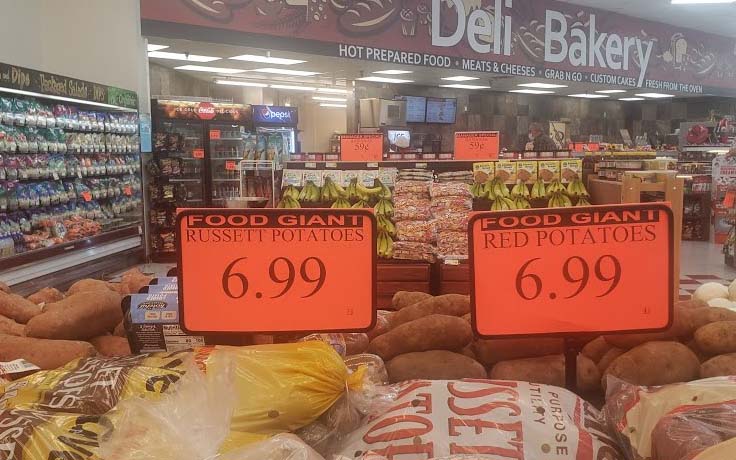
2. & 3. The highly watched Southwest CPI index produced each month by the U.S. Labor Department shows Arkansas consumers are seeing higher energy and food prices in March. (Photos by Daily Record Staff)